EIS Technique
When study electrochemical systems, electrochemical impedance spectroscopy (EIS) can give kinetic and mechanistic information using variety of techniques and output formats. For this reason, EIS has been a powerful tool in the study of corrosion, batteries, fuel cells and electro-organic synthesis.
In an electrochemical cell, slow electrode kinetics, slow preceding chemical reactions and diffusion can all impede electron flow and can be considered and analogous to the resistors, capacitors and inductors that impede the flow of electron in and ac circuit.
EIS Plots
The EIS experiment involves applying a small sinusoidal voltage or current perturbation around a steady-state value and measuring the resulting current or voltage along with the phase angle. Using this data the real and imaginary impedances are calculated and plotted against each other for different perturbation frequencies. The Nyquist plots are the most common way of analyzing impedance data which makes it easy to see the effects of ohmic resistance. The Bode Plots provide explicit information which examines the absolute impedance and phase shift of the impedance as a function of frequency.
|
Equivalent Circuit Elements
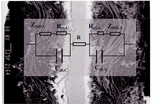
The EIS data are commonly interpreted with equivalent circuit element models. These models are built with the help of well-known passive elements such as, resistors, capacitors, and inductors and distributed elements such as, constant phase element and Warburg impedance. These elements can be combined in series and parallel to give complex equivalent circuits. A certain physical meaning is then assigned to the various elements of the equivalent circuit. The equivalent circuit element approach provides with a quick visualization tool to understand system behavior and limitations. A typical electrochemical impedance experimental setup consists of an electrochemical cell (the system under investigation), a potentiostat/galvanostat, and a frequency response analyzer (FRA). The FRA applies the sine wave and analyses the response of the system to determine the impedance of the system. |
|
Ecscell offers electrochemical analysis equipment. Please contact us should you require assistance for setting up fuel cell and microbial fuel cell testing systems.
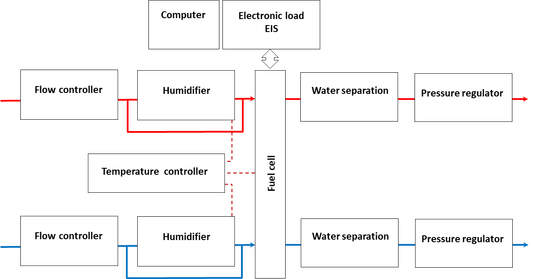
Ecscell fuel cell test system
Ecscell fuel cell test systems configure all key features to achieve stable, reliable and repeatable fuel cell operating conditions. The systems couple with an electronic load and impedance meter to support in-situ impedance measurement for fuel cell.
Application software enables test for fuel cell characteristic such as polarization I-V curve, iR measurement with current Interrupt method and Cole-Cole plot by the AC impedance method.